


AI-Native Creative Intelligence Platform
AI-Native Creative Intelligence Platform
AI-Native Creative Intelligence Platform

Make Creative Decisions Based on Data, not Opinions
Make Creative Decisions Based on Data, not Opinions
Make Creative Decisions Based on Data, not Opinions
Hawky is purpose-built to analyze ad performance, decode competitor strategies, and generate winning creatives - all backed by real campaign data.
Hawky is purpose-built to analyze ad performance, decode competitor strategies, and generate winning creatives - all backed by real campaign data.
Hawky is purpose-built to analyze ad performance, decode competitor strategies, and generate winning creatives - all backed by real campaign data.

Hawky’s AI suite streamlined our creative analysis, cutting CPL by 27% and saving 160+ hours per brand monthly. Real-time insights have sharpened our campaign strategies. It’s been a seamless shift to smarter work.
Hawky’s AI suite streamlined our creative analysis, cutting CPL by 27% and saving 160+ hours per brand monthly. Real-time insights have sharpened our campaign strategies. It’s been a seamless shift to smarter work.
Hawky’s AI suite streamlined our creative analysis, cutting CPL by 27% and saving 160+ hours per brand monthly. Real-time insights have sharpened our campaign strategies. It’s been a seamless shift to smarter work.

Abhishek Upadhya
Abhishek Upadhya
Abhishek Upadhya
SVP - Digital Strategy & Innovation
SVP - Digital Strategy & Innovation
SVP - Digital Strategy & Innovation
Hiveminds
Hiveminds
Hiveminds

The first time I used Hawky, I was like wow. It literally showed me what worked in our ads, down to small details like a background shade or where the logo sat. We applied its suggestions and… CTR + conversions shot up 20% in just 7 days.
The first time I used Hawky, I was like wow. It literally showed me what worked in our ads, down to small details like a background shade or where the logo sat. We applied its suggestions and… CTR + conversions shot up 20% in just 7 days.
The first time I used Hawky, I was like wow. It literally showed me what worked in our ads, down to small details like a background shade or where the logo sat. We applied its suggestions and… CTR + conversions shot up 20% in just 7 days.

Dinesh Arora
Dinesh Arora
Dinesh Arora
SVP of Marketing
SVP of Marketing
SVP of Marketing
Univest
Univest
Univest
Why choose Hawky
Why choose Hawky
Why choose Hawky
Our platform delivers measurable results that transform your marketing performance
Our platform delivers measurable results that transform your marketing performance
Our platform delivers measurable results that transform your marketing performance
Real-time Performance Tracking
Real-time Performance Tracking
Real-time Performance Tracking
Monitor campaign performance in real-time with AI-powered alerts and recommendations.
Monitor campaign performance in real-time with AI-powered alerts and recommendations.
Monitor campaign performance in real-time with AI-powered alerts and recommendations.
Scale High-Performing Creatives
Scale High-Performing Creatives
Scale High-Performing Creatives
Focus on the creative elements that drive results and scale your best-performing campaigns.
Focus on the creative elements that drive results and scale your best-performing campaigns.
Focus on the creative elements that drive results and scale your best-performing campaigns.
Decode Algorithms
Decode Algorithms
Decode Algorithms
Understand how ad platforms work and optimize your creatives to align with their algorithms.
Understand how ad platforms work and optimize your creatives to align with their algorithms.
Understand how ad platforms work and optimize your creatives to align with their algorithms.
Cut Down Wasted Ad Spend
Cut Down Wasted Ad Spend
Cut Down Wasted Ad Spend
Spend your budget where it matters by identifying and eliminating underperforming creatives.
Spend your budget where it matters by identifying and eliminating underperforming creatives.
Spend your budget where it matters by identifying and eliminating underperforming creatives.
Cross-Platform Analysis
Cross-Platform Analysis
Cross-Platform Analysis
Compare performance across multiple platforms to identify the best channels for your audience.
Compare performance across multiple platforms to identify the best channels for your audience.
Compare performance across multiple platforms to identify the best channels for your audience.
Automate Compliance
Automate Compliance
Automate Compliance
Ensure all your creatives meet brand, legal, and channel requirements automatically.
Ensure all your creatives meet brand, legal, and channel requirements automatically.
Ensure all your creatives meet brand, legal, and channel requirements automatically.
Creative Analysis
Creative Analysis
Creative Analysis
Understand exactly why your ads work (or don't)
Understand exactly why your ads work (or don't)
Understand exactly why your ads work (or don't)
Element-Level Performance Insights
Element-Level Performance Insights
Element-Level Performance Insights
Understand exactly which hooks, CTAs, & visual elements drive results
Understand exactly which hooks, CTAs, & visual elements drive results
Understand exactly which hooks, CTAs, & visual elements drive results
Performance Reports
Performance Reports
Performance Reports
Get detailed reports of why creatives fail or succeed, not just performance metrics
Get detailed reports of why creatives fail or succeed, not just performance metrics
Get detailed reports of why creatives fail or succeed, not just performance metrics
Creative Fatigue Prediction
Creative Fatigue Prediction
Creative Fatigue Prediction
Know when your creatives will burn out before performance drops
Know when your creatives will burn out before performance drops
Know when your creatives will burn out before performance drops
Data-Driven Optimization
Data-Driven Optimization
Data-Driven Optimization
Receive specific recommendations based on your brand's winning patterns
Receive specific recommendations based on your brand's winning patterns
Receive specific recommendations based on your brand's winning patterns

Competitor Intelligence
Competitor Intelligence
Competitor Intelligence
See what creative strategies are winning in your market
See what creative strategies are winning in your market
See what creative strategies are winning in your market
Competitor Creative Strategy Insights
Competitor Creative Strategy Insights
Competitor Creative Strategy Insights
Analyze what's driving your competitors' success in shared audiences
Analyze what's driving your competitors' success in shared audiences
Analyze what's driving your competitors' success in shared audiences
Winning Pattern Identification
Winning Pattern Identification
Winning Pattern Identification
Discover market trends and successful creative approaches you're missing
Discover market trends and successful creative approaches you're missing
Discover market trends and successful creative approaches you're missing
Competitive Gap Analysis
Competitive Gap Analysis
Competitive Gap Analysis
Identify opportunities where competitors are outperforming your creative strategy
Identify opportunities where competitors are outperforming your creative strategy
Identify opportunities where competitors are outperforming your creative strategy
Market Intelligence Reports
Market Intelligence Reports
Market Intelligence Reports
Get detailed Reports on which creatives, creative elements CTA, messaging are winning in your market.
Get detailed Reports on which creatives, creative elements CTA, messaging are winning in your market.
Get detailed Reports on which creatives, creative elements CTA, messaging are winning in your market.

AI Creative Generation
AI Creative Generation
AI Creative Generation
Generate new creatives based on proven patterns
Generate new creatives based on proven patterns
Generate new creatives based on proven patterns
Lightning-Fast AI Generation
Lightning-Fast AI Generation
Lightning-Fast AI Generation
Create 20+ creative variants in seconds, while human teams produce 3-5 per week
Create 20+ creative variants in seconds, while human teams produce 3-5 per week
Create 20+ creative variants in seconds, while human teams produce 3-5 per week
Data-Driven Creative Creation
Data-Driven Creative Creation
Data-Driven Creative Creation
Generate creatives based on your winning patterns and competitor intelligence
Generate creatives based on your winning patterns and competitor intelligence
Generate creatives based on your winning patterns and competitor intelligence
Built-in Canva-like Editor
Built-in Canva-like Editor
Built-in Canva-like Editor
Edit and customize creatives with Canva-style capabilities without switching platforms
Edit and customize creatives with Canva-style capabilities without switching platforms
Edit and customize creatives with Canva-style capabilities without switching platforms
Multi-Platform Adaptation
Multi-Platform Adaptation
Multi-Platform Adaptation
Instantly create variations for different formats, aspect ratios, and languages
Instantly create variations for different formats, aspect ratios, and languages
Instantly create variations for different formats, aspect ratios, and languages

How Hawky Works
How Hawky Works
How Hawky Works
Combines insights to auto-generate high-converting ad assets
Combines insights to auto-generate high-converting ad assets
Combines insights to auto-generate high-converting ad assets


Step 1
Step 1
Step 1
Integrate All Your Ad Accounts
Integrate All Your Ad Accounts
Integrate All Your Ad Accounts
Get a comprehensive overview of your financial performance. Monitor net sales, visualize trends over time, and make data-driven decisions to optimize your revenue growth.
Get a comprehensive overview of your financial performance. Monitor net sales, visualize trends over time, and make data-driven decisions to optimize your revenue growth.
Get a comprehensive overview of your financial performance. Monitor net sales, visualize trends over time, and make data-driven decisions to optimize your revenue growth.

Step 2
Step 2
Step 2
Identify Winning Elements
Identify Winning Elements
Identify Winning Elements
Easily organize and track all active discounts in one place. Keep your promotions up-to-date and ensure your customers enjoy the best offers tailored to their needs.
Easily organize and track all active discounts in one place. Keep your promotions up-to-date and ensure your customers enjoy the best offers tailored to their needs.
Easily organize and track all active discounts in one place. Keep your promotions up-to-date and ensure your customers enjoy the best offers tailored to their needs.

Step 3
Step 3
Step 3
Analyse Competitor Strategy
Analyse Competitor Strategy
Analyse Competitor Strategy
Understand your marketing performance at a glance. Track online sessions, monitor conversions, and adjust your strategies to drive better engagement and sales.
Understand your marketing performance at a glance. Track online sessions, monitor conversions, and adjust your strategies to drive better engagement and sales.
Understand your marketing performance at a glance. Track online sessions, monitor conversions, and adjust your strategies to drive better engagement and sales.

Step 4
Step 4
Step 4
Produce Winning Creatives
Produce Winning Creatives
Produce Winning Creatives
Gain insights into key metrics, compare performance over time, and stay on top of trends. From sales data to customer behavior, make informed decisions with powerful analytics at your fingertips.
Gain insights into key metrics, compare performance over time, and stay on top of trends. From sales data to customer behavior, make informed decisions with powerful analytics at your fingertips.
Gain insights into key metrics, compare performance over time, and stay on top of trends. From sales data to customer behavior, make informed decisions with powerful analytics at your fingertips.

Step 5
Step 5
Step 5
Optimise Performance
Optimise Performance
Optimise Performance
Gain insights into key metrics, compare performance over time, and stay on top of trends. From sales data to customer behavior, make informed decisions with powerful analytics at your fingertips.
Gain insights into key metrics, compare performance over time, and stay on top of trends. From sales data to customer behavior, make informed decisions with powerful analytics at your fingertips.
Gain insights into key metrics, compare performance over time, and stay on top of trends. From sales data to customer behavior, make informed decisions with powerful analytics at your fingertips.
Launch
Launch
Launch
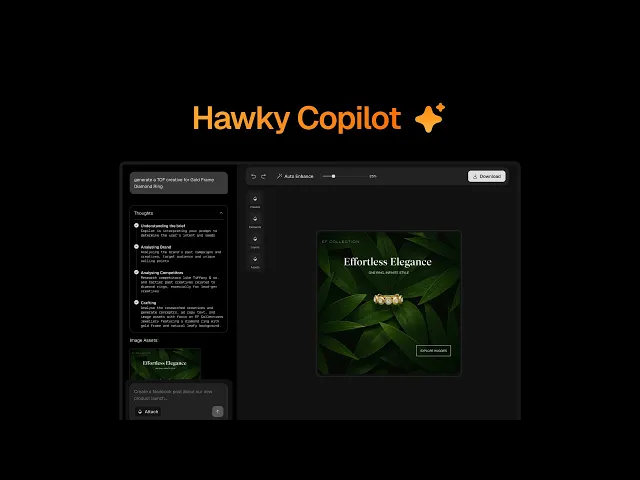
ChatGPT for Performance Marketers
ChatGPT for Performance Marketers
ChatGPT for Performance Marketers
Just type a prompt - Hawky’s Copilot builds high-converting visuals and copy, backed by your brand’s and competitors’ winning ad data.
Just type a prompt - Hawky’s Copilot builds high-converting visuals and copy, backed by your brand’s and competitors’ winning ad data.
Just type a prompt - Hawky’s Copilot builds high-converting visuals and copy, backed by your brand’s and competitors’ winning ad data.
Seamless Integrations
Seamless Integrations


Ready to Stop Guessing and Start Winning with Creative Intelligence?
Connect your ad accounts and get actionable insights on what's working and what needs optimization.
Company
Ready to Stop Guessing and Start Winning with Creative Intelligence?
Company
Ready to Stop Guessing and Start Winning with Creative Intelligence?
Connect your ad accounts and get actionable insights on what's working and what needs optimization.
Company